Gardener Observability 2.0: An Unified Approach
Observability in Kubernetes has come a long way, but traditional approaches—like those currently used in the Gardener project—face growing pains. Siloed tools, fragmented data, and outdated standards are holding back efficient troubleshooting and system insights. Enter Observability 2.0, a modern paradigm powered by OpenTelemetry (OTel) that promises to unify logs, metrics, and traces into a cohesive, interoperable framework. This blog explores the limitations of Gardener’s current observability practices, introduces the principles of Observability 2.0, and outlines a roadmap for its adoption in the Gardener ecosystem.
1. Observability 1.0: Where Gardener Stands Today
Gardener, a Kubernetes clusters management platform, relies on a traditional observability stack that treats metrics, logs, and traces (not available in gardener) as separate entities. While functional, this approach introduces complexity, vendor lock-in, and inefficiencies that slow down incident resolution.
Logging: Fluent-bit, Vali, and the Metadata Struggle
In Gardener, logs are collected using Fluent-bit, stored in Vali, and visualized via Plutono. Fluent-bit’s plugin-based architecture is a strength, supporting diverse input/output formats[^1] and custom extensions—like Gardener’s bespoke Vali output plugin[^2]. To make logs actionable, Lua scripts enrich them with metadata such as container_name, namespace_name, and pod_name. Example:
{
  "container_name": "nginx-container",
  "namespace_name": "default",
  "pod_name": "nginx",
  "log": "I0227 12:55:45.388871   7 controller.go:216] \"Backend successfully reloaded\""
}
This metadata is invaluable for searching, aggregating, and alerting. However, challenges emerge:
- Exporting Logs: When logs leave Gardener’s domain, mismatched field names require a translation layer, complicating integration with external systems.
- Vali’s Limitations: Vali lacks support for modern standards like OpenTelemetry and struggles with structured logs or distributed traces, hindering correlation with other observability signals.
These gaps make troubleshooting less efficient than it could be, especially in complex, multi-cluster environments.
Metrics: Prometheus Dominance and Its Limits
For metrics, Gardener leans on Prometheus, the Kubernetes gold standard. Prometheus scrapes time-series data from endpoints, providing insights like:
kube_pod_container_status_ready{namespace="default", pod="nginx", container="nginx-container"} 1Prometheus excels at metric collection, but its rigid storage model doesn’t handle high-cardinality data or structured events well. More critically, it operates in isolation from logs and traces. For instance, a log’s container_name doesn’t natively align with a metric’s container label, forcing engineers to manually bridge these gaps during incidents.
The Pain Points of Observability 1.0
Gardener’s current setup reflects broader challenges in Observability 1.0:
- Siloed Signals: Logs, metrics, and traces live in separate worlds, with no native correlation.
- Tool Sprawl: Maintaining distinct infrastructures for each signal increases overhead.
- Query Challenges: Each tool demands its own query language, steepening the learning curve.
- Slow MTTR: Manual correlation delays Mean Time to Resolution (MTTR)
Observability 2.0: A Unified Vision with OpenTelemetry
OpenTelemetry standardizes how observability data is collected, processed, and exported. Its key benefits include:
- Unified Data Model: Logs, metrics, and traces share a consistent format[^3].
- Vendor Freedom: Export data to any backend — Prometheus, VictoriaLogs, Jaeger, and more.
- Shared Semantics: Common attributes (e.g., k8s.pod.name) ensure interoperability[^4].
- Context Propagation: Automatically correlates signals across distributed systems[^5].
- Auto-Instrumentation: Simplifies adoption with language-specific support (e.g., Go)[^6][^7].
Industry Momentum
The observability ecosystem is rallying around OpenTelemetry:
- Prometheus now ingests OTel metrics[^8].
- VictoriaLogs[^9] and Loki support OTel logs.
- Fluent-bit forwards logs in OTel format[^10].
- VictoriaLogs[^11] and Tempo as distributed tracing storage.
This convergence signals a future where tools interoperate effortlessly, reducing complexity and boosting efficiency.
3. Bringing Observability 2.0 to Gardener
To overcome the limitations of Observability 1.0, Gardener can evolve its stack by employing OpenTelemetry open standards and toolsets.
Here is a general diagram followed by an implementation roadmap: 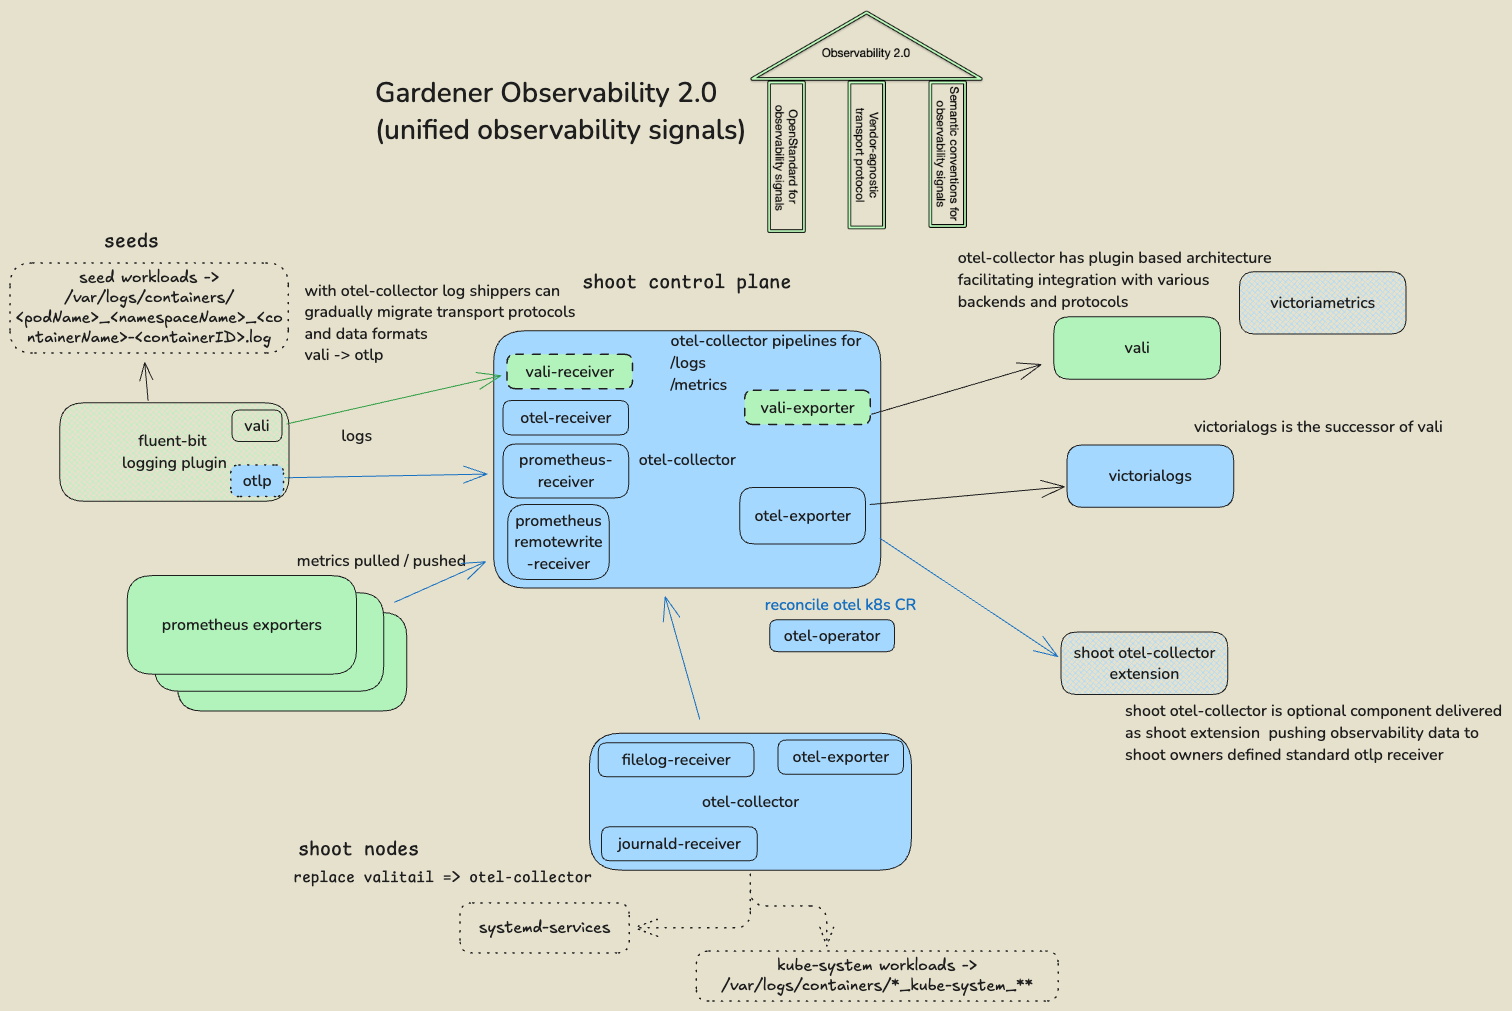
Here’s a proposed roadmap:
Step 1: Gardener OpenTelemetry Collector Distribution
- Goal: Establish a tailored OpenTelemetry Collector distribution for Gardener to support its observability needs.
- Details: OpenTelemetry offers four main collector distributions[^12], ranging from the minimal
OTLP Distro(supporting only OTLP receivers and exporters) to the comprehensiveContrib Distro(including all available plugins). For Gardener, we propose starting with theCore Distroas a base, augmented with receivers and exporters for the existing stack (e.g.,Vali,Prometheus) and processors for advanced features like routing, filtering, and sampling. This custom distribution will support current signal formats (vali,prometheus) while enabling a gradual shift to otel. The plugin set will evolve to reflect Gardener’s supported scenarios, ensuring flexibility for future enhancements. - Outcome: A Gardener-specific OTel Collector with a Vali receiver and OTLP exporter[^13] enables a smooth transition from Vali to OTLP-compatible backends, laying the foundation for unified observability.
Step 2: Opentelemetry-Operator for Seeds
- Goal: Deploy the OpenTelemetry Operator to manage OTel Collector instances across Gardener Seeds.
- Details: To streamline observability component management, we’ll introduce the OpenTelemetry Operator on Seeds, mirroring the design of the Fluent-bit and Prometheus Operators. This operator will orchestrate OTel Collector deployments per Shoot Control Plane. An example pipeline configuration supports
loki(compatible with Gardener’s Vali-based Fluent-bit plugin) andk8s_eventsreceivers, exporting logs to VictoriaLogs via OTLP/HTTP:
---
apiVersion: opentelemetry.io/v1beta1
kind: OpenTelemetryCollector
metadata:
  name: shoot-otel-collector
  namespace: shoot-control-plane
spec:
  mode: deployment
  serviceAccount: shoot-otel-collector
  config:
    # Receivers definitions
    receivers:
      loki:
        protocols:
          http:
            endpoint: 0.0.0.0:3100
      k8s_events:
        namespaces:
          - "<shoot-control-plane>"
    # Processors definitions
    processors:
      batch:
        timeout: 5s
        send_batch_size: 1000
    # Exporters definitions
    exporters:
      otlphttp:
        logs_endpoint: http://victorialogs-victoria-logs-single-server.victoria-logs.svc.cluster.local:9428/insert/opentelemetry/v1/logs

    # Pipeline definitions, glues together the receivers, processors and exporters.
    service:
      pipelines:
        logs:
          receivers: [loki,k8s_events]
          processors: [batch]
exporters: [otlphttp]- Outcome: Each Shoot Control Plane gains a dedicated OTel Collector, enabling independent logging stack migration, obsoleting the
event logger, and paving the way for broader monitoring enhancements.
Step 3: Migrate Shoot log shippers from valitail to otel-collector
- Goal: Replace
ValitailwithOTel Collectorfor log shipping on Shoot nodes. - Details: The OTel Collector offers journald[^14] and filelog[^15] receivers, fully covering Valitail’s current use cases on Shoot nodes. Logs will be pushed to the Shoot Control Plane’s OTel Collector (on Seeds) via OTLP exporters. This shift also opens the door to pushing metrics from Shoot node exporters, transitioning from Prometheus’ pull-based model (via kube-apiserver proxy) to a push-based approach. This reduces kube-apiserver load and enhances metric configuration flexibility.
- Outcome: Shoot observability signals adopt a unified OTLP format, replacing a stagnant Valitail with an actively developed, versatile component.
Step 4: Format Fluent-Bit Inputs as OTel logs
- Goal: Enable Fluent-bit to collect logs in OTLP format from the source.
- Details: We’ll update Fluent-bit’s input configurations to produce end-to-end OTLP logs using the opentelemetry_envelope processor[^16], which groups logs with metadata:
---
apiVersion: fluentbit.fluent.io/v1alpha2
kind: ClusterInput
metadata:
  name: tail-kube
  labels:
    fluentbit.fluent.io/enabled: "true"
spec:
  tail:
    excludePath: "\"*fluent-bit*\""
    path: "/var/log/containers/*.log"
    refreshIntervalSeconds: 10
    skipLongLines: true
    readFromHead: false
    tag: "kube.*"
    parser: "cri"
    ...
  processors:
    logs:
      - name: opentelemetry_envelope
Since Fluent-bit lacks native programmatic modification of OTLP resource attributes, we’ll retain Lua scripting to add attributes like k8s.pod.name:
function add_kube_attr(tag, timestamp, record)

  -- Split the tag into its components
  local stripped_tag = tag:match("kube%.var%.log%.containers%.(.*)%.log")
  local podName, namespaceName, containerName, containerID = stripped_tag:match("([^_]+)_([^_]+)_(.*)%-(.*)")

  -- Extract the log message
  local log = record["message"]

  -- Use otel semantic convetions for k8s metadata
  -- https://opentelemetry.io/docs/specs/semconv/resource/k8s/
  record["k8s.pod.name"] = podName
  record["k8s.namespace.name"] = namespaceName
  record["k8s.container.name"] = containerName
  record["k8s.container.id"] = containerID
  record["log"] = log
  record["message"] = nil

  return 1, timestamp, record
end- Outcome: Logs adopt OTLP format at collection, enabling downstream operations with OTel’s standardized attributes.
Step 5: OTLP in Fluent-Bit Output - Gardener Logging Plugin
- Goal: Enhance the Gardener Fluent-bit output plugin to support OTLP.
- Details: The current plugin relies on Valitail to ship logs to Vali. To support OTLP-compatible backends (e.g., VictoriaLogs, ClickHouse), we’ll extend the plugin to use
otlphttpas a transport protocol. This requires updating the plugin to handle OTLP formatting and configurable backend endpoints. - Outcome: The plugin’s OTLP support decouples log shippers from Vali, enabling seamless transitions to modern OTel backends.
Step 6: VictoriaLogs in Shoot Control Plane namespaces (on Seeds)
- Goal: Replace Vali with VictoriaLogs as an OTLP-enabled logging and tracing backend.
- Details: VictoriaLogs, an actively developed project with strong community support, offers native OTLP ingestion and outperforms Loki and Elasticsearch in benchmarks[^17]. We’ll deploy it in Shoot Control Plane namespaces on Seeds, leveraging its OTLP endpoint. If the planned migration tool[^18] becomes available, existing Vali Persistent Volumes (PVs) can be migrated. VictoriaLogs provides a UI and Grafana DataSource, though compatibility requires Grafana 10+ (Plutono is currently version 7).
- Outcome: Logs and traces shift to an OTLP-native backend, eliminating vendor lock-in and enhancing performance.
Step 7: Otel-collector (as Gardener Extension) for shoots
- Goal: Offer an OTel Collector extension for Shoot owners to consume observability signals.
- Details: Post-migration to OTLP, we’ll introduce an OTel Collector extension for Shoot Control Planes:
apiVersion: extensions.gardener.cloud/v1alpha1
kind: Extension
metadata:
  name: extension-otel-collector
  namespace: shoot--project--name
spec:
  type: shoot-otel-collector
  providerConfig:
    apiVersion: otel-collector.extensions.gardener.cloud/v1alpha1
    kind: ExporterConfig
    exporter: otlp
    endpoint: otelcol2:4317
    tls:
      cert_file: file.cert
      key_file: file.key
...
This extension pushes pre-filtered logs and metrics from Shoot Control Plane components (on Seeds) to Shoot owner-specified OTLP endpoints (e.g., via OTLP/GRPC or OTLP/HTTP with mTLS authentication), controlling data volume with presets or filters.
- Outcome: Shoot owners gain a vendor-agnostic, standards-based mechanism to access observability signals.
Step 8: Unify Visualization
- Goal: Deliver a unified UI for all observability signals in Gardener.
- Details: No mature open-source tool currently visualizes logs, metrics, and traces holistically. Grafana 7 (last Apache-2 licensed version) and Plutono lack full OTLP support. The CNCF’s Perses project[^19], an incubating OSS solution, aims to address this but remains immature without widespread vendor backing. For now, this step remains exploratory, awaiting Perses’ maturation or alternative solutions.
- Outcome: A single, future-ready visualization tool consolidates Gardener’s observability stack.
Expected Outcomes
Enhanced Incident Response: Unified OTLP signals with shared semantics accelerate issue detection and resolution, cutting MTTR by enabling cross-layer insights.
Simplified Operations: A standardized pipeline reduces tool sprawl and maintenance complexity, streamlining Gardener’s observability infrastructure.
Scalable Evolution: OTLP adoption aligns Gardener with industry standards, supporting tracing and future integrations without vendor constraints.
Conclusion
Gardener’s Observability 1.0 has been a solid foundation, but its limitations are increasingly apparent in a world demanding unified, efficient monitoring. Observability 2.0, powered by OpenTelemetry, offers Gardener a transformative opportunity to modernize its stack. The proposed roadmap, gardener collector distribution, operator deployment, log shipper migration, and backend upgrades, sets the stage for a cohesive observability future. By embracing these changes, Gardener not only overcomes current inefficiencies but also positions itself ready for the challenges of tomorrow. Needles to say but for the sake of completeness in the scope transformation to the Observability 2.0 are not only the Shoot clusters but also the Garden and the Seed clusters.
References: [^1]: Fluent-Bit Outputs [^2]: Fluent-Bit Outputs Golang APIs [^3]: Otel Specification Status [^4]: OTel Semantic Conventions [^5]: OTel Context Propagation [^6]: OTel Go Compile-Time Instrumentation [^7]: OTel Go Run-time Instrumentation (eBPF) [^8]: Prometheus 3 OTel Receiver [^9]: Victoria-Logs OTel Ingestion [^10]: Fluent-Bit OTel Output [^11]: VictoriaLogs as distributed tracing storage - Intent [^12]: OTel Collector Releases [^13]: Gardener OTel Collector Distribution [^14]: OTel journald receiver [^15]: OTel filelog receiver [^16]: Fluent-Bit otel processor [^17]: VictoriaLogs Benchmarks [^18]: VictoriaLogs Roadmap [^19]: GitHub Perses